|
|
Michael Drolet -- 2005 |
| Home | PHYSICS
OF
SOUND |
| |
|
|
|
Michael Drolet -- 2005 |
| Home | PHYSICS
OF
SOUND |
| |
|
| Our aim is to attain a basic understanding of: | |
| Sound |
|
| Acoustics |
|
| Audio |
|
| For our purposes: | |
| Sound is the transmission of vibrations in air as perceived by the human ear. | |
| Theatre |
|
Sources of Sound
How is sound generated?
Sound is generated by a vibrating source as waves of changing pressure. Human
- vocal chords
Musical instruments
- strings
- guitar
- violin
- membrane
- gong
- drum skin
Electro-mechanical
- loudspeaker diaphragm
| How does sound propagate? | |||
| Sound travels at a finite speed, dependent on the density of the medium. | |||
| Speed of Sound | |||
| Medium |
|
|
|
|
|
|
|
|
|
|
|
|
|
|
|
|
|
|
|
|
6,600 | 22,304 | 19.6 |
Sound takes a finite time to travel from one point to another. |
|
| Travel Time | |
|
|
|
|
|
|
|
|
|
|
|
|
|
|
|
|
|
|
|
|
|
A sound wave has certain properties which define it. |
|
| Properties of a Sound Wave | |
| Property | 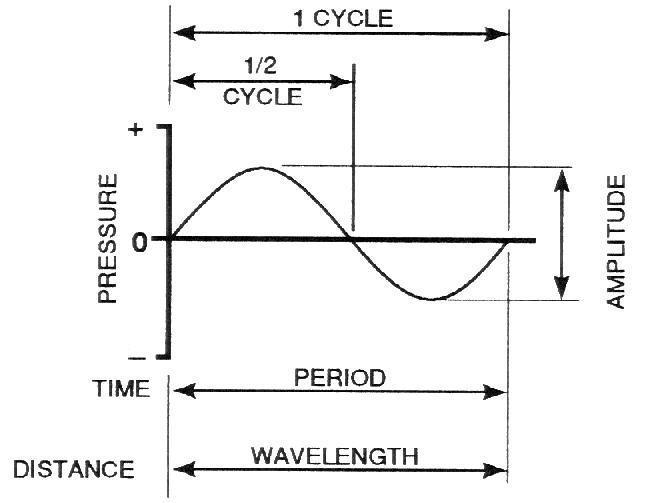 |
| Frequency |
|
| Period |
|
| Wavelength |
|
| Amplitude |
|
| Range of Human Hearing | |
|
|
|
|
|
|
|
|
|
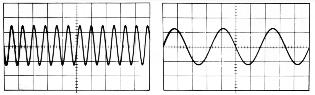
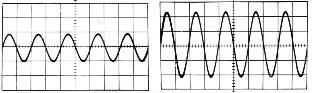
| Amplitude vs. Frequency | |
|
|
 |
|
|
 |
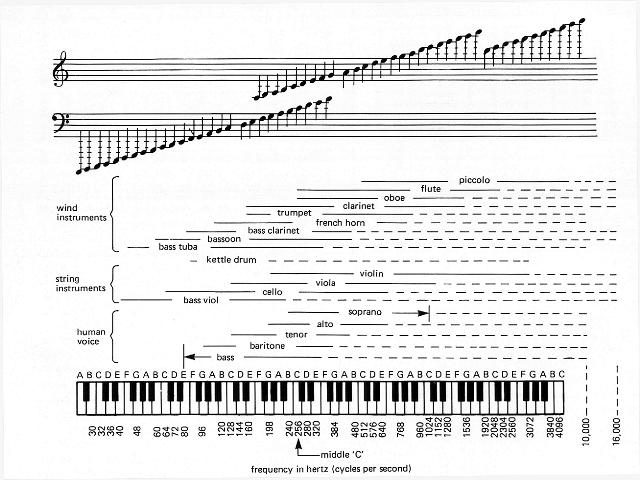
| The musical equivalent of frequency is pitch. A higher frequency has a higher pitch. A above middle C has a frequency of 440 Hz. A doubling of frequency is called and octave. |
| Frequency and Musical Pitch |
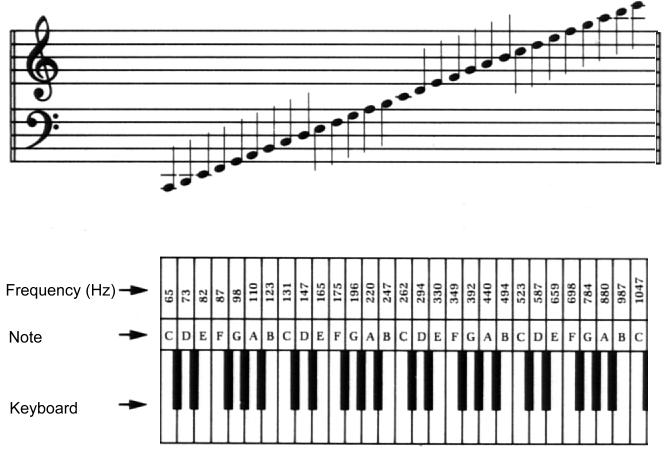 |
| Frequency Ranges of Musical Instruments |
 |
| Lower frequencies have longer wavelengths and periods. | |||
| Frequency vs. Period and Wavelength | |||
|
|
|
|
|
|
|
|
|
|
|
|
|
|
|
|
|
|
|
|
|
|
|
|
|
If we made a measuring device for intensity where the smallest division was 1 mm. ; it would have to be 100 metres wide to accomodate the loudest sound we can hear. |
||
| Sound Pressure | ||
|
|
(µPascals) |
|
| Threshold of Hearing |
|
|
| Sound Stage |
|
|
| Cinema Audience |
|
|
| Conversation |
|
|
| Noisy Factory |
|
|
| Niagara Falls |
|
|
| Threshold of Pain |
|
|
We use a logarithmic scale to represent relative intensities. Each increase of 10 times in intensity is represented by an increase of 20 decibels(dB) in Sound Pressure Level (SPL). |
||
| Sound Pressure Level | ||
|
|
(µPascals) |
|
| Threshold of Hearing |
|
|
| Sound Stage |
|
|
| Cinema Audience |
|
|
| Conversation |
|
|
| Noisy Factory |
|
|
| Niagara Falls |
|
|
| Threshold of Pain |
|
|
| Range of Human Hearing | |
|
|
|
|
|
|
|
|
|
|
|
|
| Steps of 10. | ||
|
|
||
|
|
|
decibels (dB) |
|
|
|
|
|
|
|
|
|
|
|
|
|
|
|
|
|
|
|
|
|
|
|
|
|
|
|
|
| Smaller steps. | ||
| Decibel Scale | ||
|
|
|
decibels (dB) |
|
|
|
|
|
|
|
|
|
|
|
|
|
|
|
|
|
|
|
|
|
|
|
|
|
|
|
|
|
|
|
|
|
|
|
|
|
|
|
|
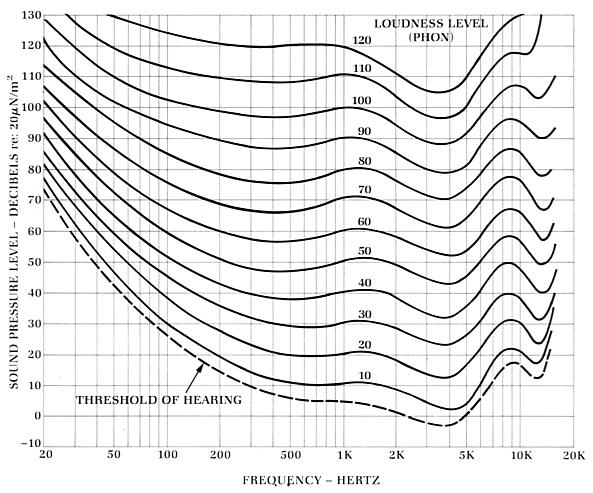
The ear is not equally sensitive to all frequencies at all levels of intensity. At low intensities, low frequencies are perceived as being less loud. |
| Frequency Sensitivity vs. Loudness |
 |