Picture   ALTEC ENGINEERING NOTES  
               
                         
                  TECHNICAL LETTER NO. 232
                         
      ONE-THIRD OCTAVE EQUALIZATION TECHNIQUES AND RECOMMENDED PRACTICES      
                         
          By Mark E. Engebretson          
                         
  One-third octave equalization has two fundamental aims in sound reinforcement systems; to increase the broadband acoustical gain of the sound system, and to increase the naturalness of the sound.
                         
  Limitations on System Acoustical Gain                  
                         
  Any sound system wherein an open microphone shares an acoustic environment with a loudspeaker will feed back when the sound from that loudspeaker arrives at the microphone with sufficient level to cause reamplification. The amount of acoustic separation between the loudspeaker and the microphone may be calculated with great accuracy, but this is useful only in arriving at the limit of gain that may be applied before a system becomes regenerative under theoretical conditions.
                         
  Altec recommended system gain equations have provided between 6 and 10 dB of margin below unity gain to allow for narrowband system/room response peaks. These response peaks will often approach 10 dB in amplitude, while being extremely narrow in bandwidth (1-2 Hz wide). This technical letter discusses objectives, techniques and limitations for 1/3-octave equalization. Technical Letter No. 229 deals with the application of narrowband filters; however, contractors are urged to apply 1/3-octave filters with great care.
                         
  Where 1/3-octave filters are employed to suppress very narrow system/room response peaks, the result is a broad dip in the system's response that is neither necessary nor desirable.
                         
  Spectrum Shaping                      
                         
  Experience with equalized sound systems during the last several years has resulted in the recommendation that speech-reinforcement systems be rolled off above 1-2 kHz. Figure 1 shows such a rolloff curve starting at 1 kHz with a 3 dB/octave slope.
                         
  It should be noted that the exact rolloff characteristic is dependent on many complex factors; air absorption at high frequencies, differences between direct and random incidence response of the microphone used for measurement, differences in directivity factor by frequency as generated by the loudspeaker system installed, and the reverberant nature by frequency of the room.
                         
  Figure 2 is a suggested rolloff curve for cinema systems, and would apply also for most high-level music reproduction systems.
                         
                     
      FREQUENCY IN HERTZ      
             
Picture
             
  Figure 1. Recommended Response Curve for Speech-Reinforcement Systems  
             
      FREQUENCY IN HERTZ      
             
Picture
             
    Figure 2. Recommended Response Curve for Cinema Systems    
 Figure 3 shows typical examples of control room contours in recording studios, the selection of the contour and finishing of the frequency extremes being the personal preference of the studio engineer. Figure 3b is typical of the contour sought by entertainers for high-level-rock reinforcement systems.
                   
      FREQUENCY IN HERTZ        
                   
  Picture  
                   
        (a)          
                   
      FREQUENCY IN HERTZ        
                   
  Picture    
        (b)          
                   
    Figure 3. Recommended Contours for Studio Monitor Systems      
    A ±2 dB tolerance would be in order for the curves shown in Figures 1-3; however, these contours are suggested as starting points only. There is no substitute for the ability to listen carefully and make empirical judgments.  
                 
    Application of the Filters          
                 
    Two basic methods of system contouring are available to the sound engineer. The first employs the sound system microphone for the measurement and subsequent equalization of the sound system. Such a test setup is depicted in block diagram form in Figure 4.  
                 
  Picture
                 
          Figure 4. System Equalization Using the House Microphone      
                 
    The microphone is placed in the house some distance from the loudspeaker in the reverberant field. The filter set is then adjusted for the desired contour.  
                 
    Several locations should be measured, both before and after contouring, to ensure that averaging of standing waves and null points takes place.   The microphone is then returned to its place of operation and one or two feedback modes are taken.   Great caution should be exercised during this process to ensure that the feedback correction be minimal.   One or two 1 dB filter insertions should correct all but the worst condition.  
                 
    At all times, talk the system with a qualified observer present. When the system sounds good, and provides sufficient gain, STOP! This method will yield greatest broadband gain before feedback, but is subject to more error in contour selection than the alternate method:  
                 
    Figure 5 is a block diagram of a measurement setup wherein a precision-calibrated microphone is used in place of the system microphone.  
                 
Picture
      Figure 5. Sound System Equalization Using a Calibrated Microphone    
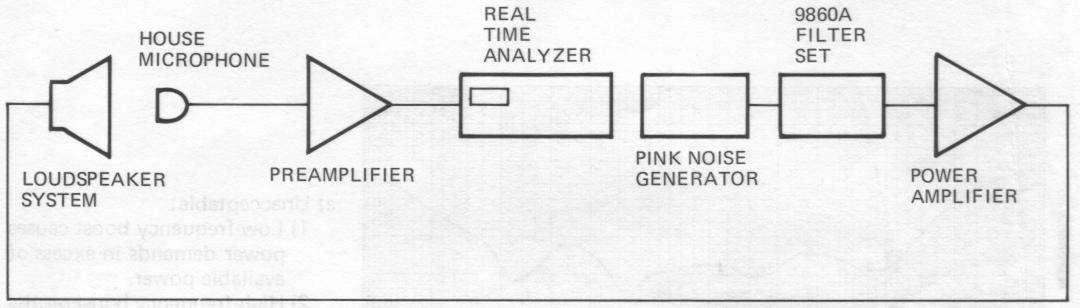
  Using this test setup, the system is equalized to a predetermined contour, with care being taken to average several readings as previously described. Once a system is so equalized, the engineer is free to select microphones that exhibit characteristics deemed desirable for the installation. Systems that employ lavalier microphones must be equalized in this manner. Feedback modes are taken as previously described, and the system is talked to determine acceptability.
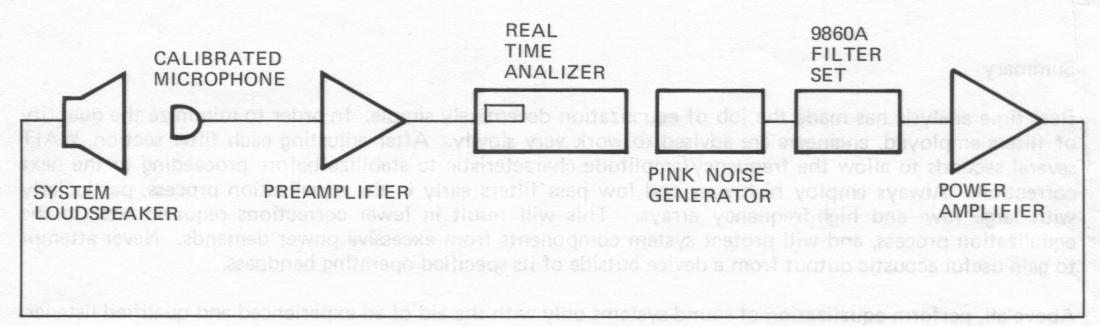
                       
  In all but a handful of extraordinary cases, the present range of components available should allow such equalization to be performed with a minimum of electrical correction.
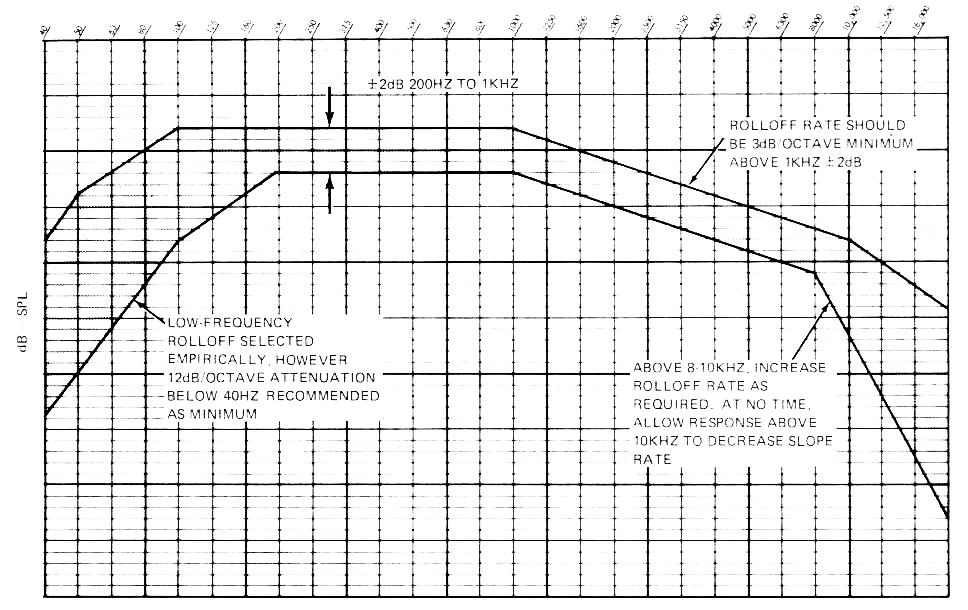
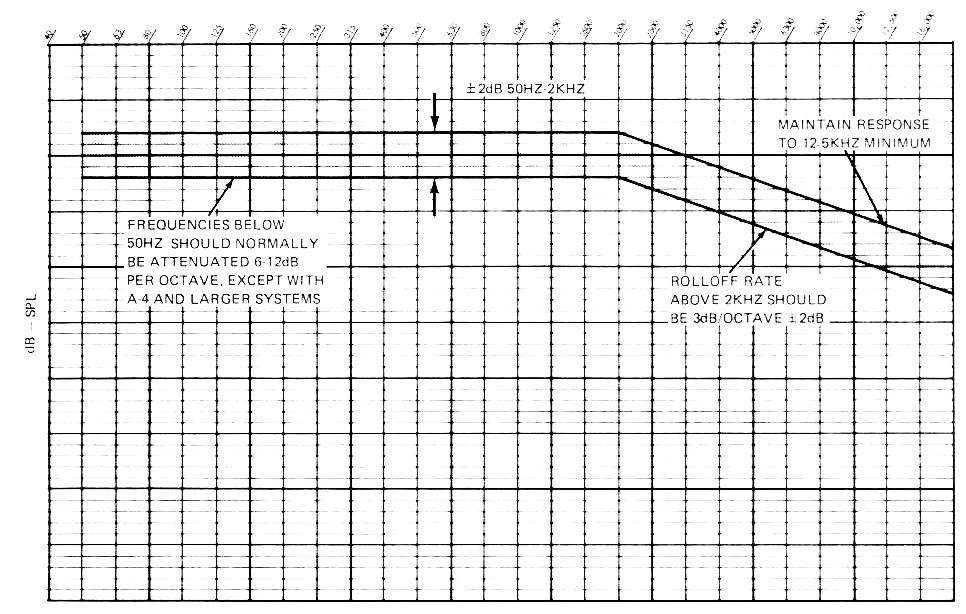
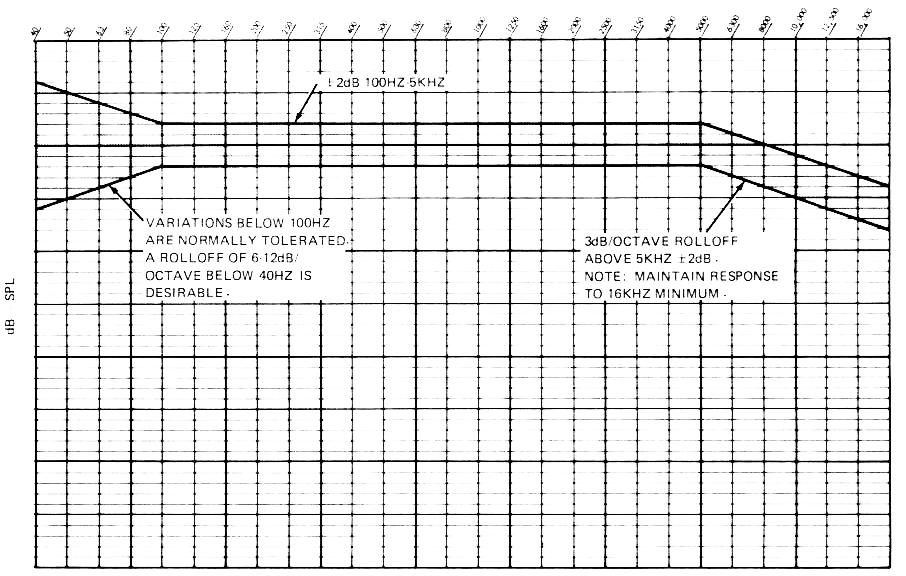
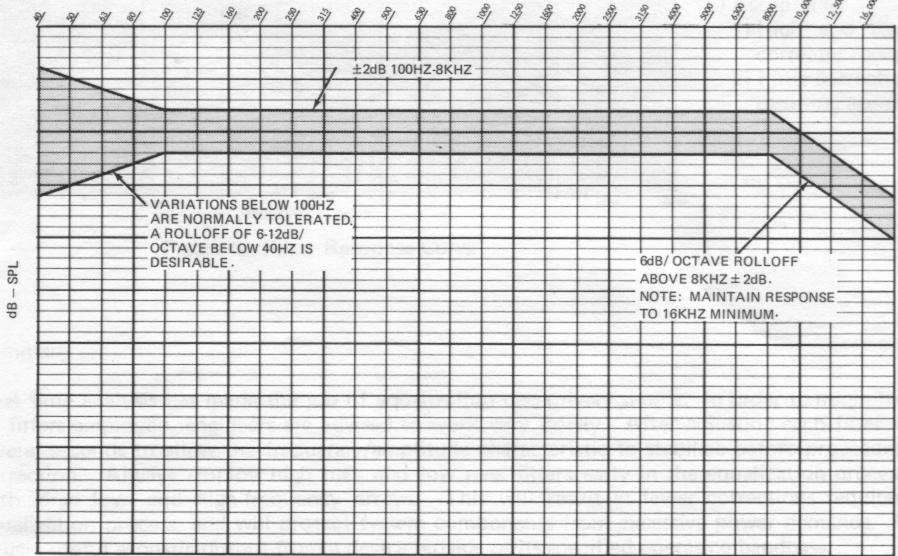
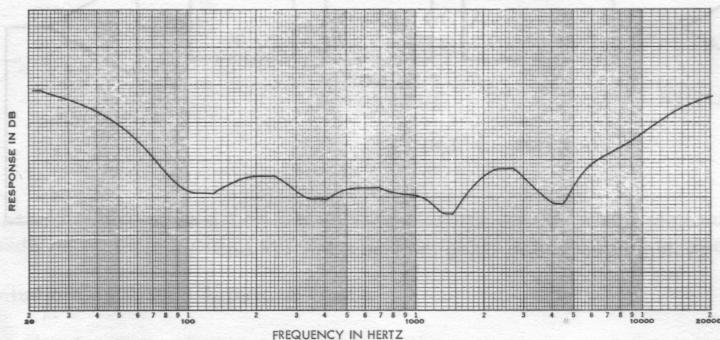
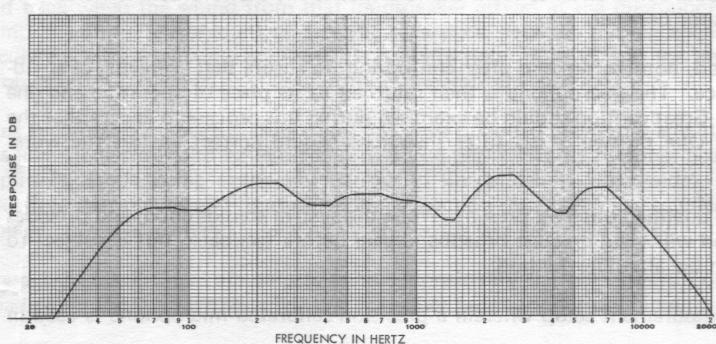
                       
  Figure 6 shows two filter response curves for the same sound systems.              
                       
Picture            
  a) Unacceptable:    
    1) Low-frequency boost causes power demands in excess of available power.
    2) High-frequency boost results in excess noise (from previous stages).
    3) Filter insertion excessive.  
           
                       
Picture            
  b) Acceptable:      
    1) High and low frequencies correctly rolled off.
    2) Filter correction minimal for resulting acoustic response.
           
                       
      Figure 6. Filter Response Curve                
                       
  Summary                    
                       
  Real time analysis has made the job of equalization deceptively simple. In order to minimize the quantity of filters employed, engineers are advised to work very slowly. After adjusting each filter section, WAIT several seconds to allow the frequency/amplitude characteristic to stabilize before proceeding to the next correction. Always employ high pass and low pass filters early in the equalization process, particularly with large low- and high-frequency arrays. This will result in fewer corrections required later in the equalization process, and will protect system components from excessive power demands.   Never attempt to gain useful acoustic output from a device outside of its specified operating bandpass.
                       
  Above all, perform equalization of sound systems only with the aid of an experienced and qualified listener. Care exercised in the equalization of sound systems will bountifully reward the sound contractor.